
Build Shared Visibility Around the Four Operating Levers
How AI Helps Manufacturers See What Is Really Happening Across the Business
AI becomes more valuable when leaders use it to create a shared view of the business across four operating levers: production flow, labor productivity, quality, and operational decisions. Instead of looking at scattered reports, isolated departments, or disconnected problems, manufacturers can use AI to see patterns, connect causes, and focus improvement efforts where they create the most value.
Key Outcomes
-
Create a Shared View of Operational Performance
Use AI to bring visibility to the four areas where manufacturing performance is won or lost: keeping production moving, using labor effectively, improving quality, and making better operational decisions.
-
Connect Problems Across the Business
See how issues in one area affect the others. Downtime affects labor productivity. Poor quality creates rework and capacity loss. Weak data leads to slower decisions. AI helps leaders see these connections more clearly.
-
Focus AI on Business Value, Not Technology
Move beyond asking, “How do we use AI?” and start asking, “Where are we losing time, margin, capacity, quality, or customer confidence?” The four operating levers give leaders a practical framework for choosing AI opportunities that matter.
-
Build a Repeatable Leadership Rhythm
Review the four levers regularly, identify the biggest constraint, use AI to improve visibility, take action, and measure what changed. Over time, this creates better alignment, faster decisions, and stronger fact-based management.
Learn your way.
Each module shares the same core message through video, infographic, podcast, slideshow, and blog post formats. Choose the format that works best for you, then complete the AI-assisted assignment at the end to apply the ideas to your business.
Play Video >
Infographic Overview
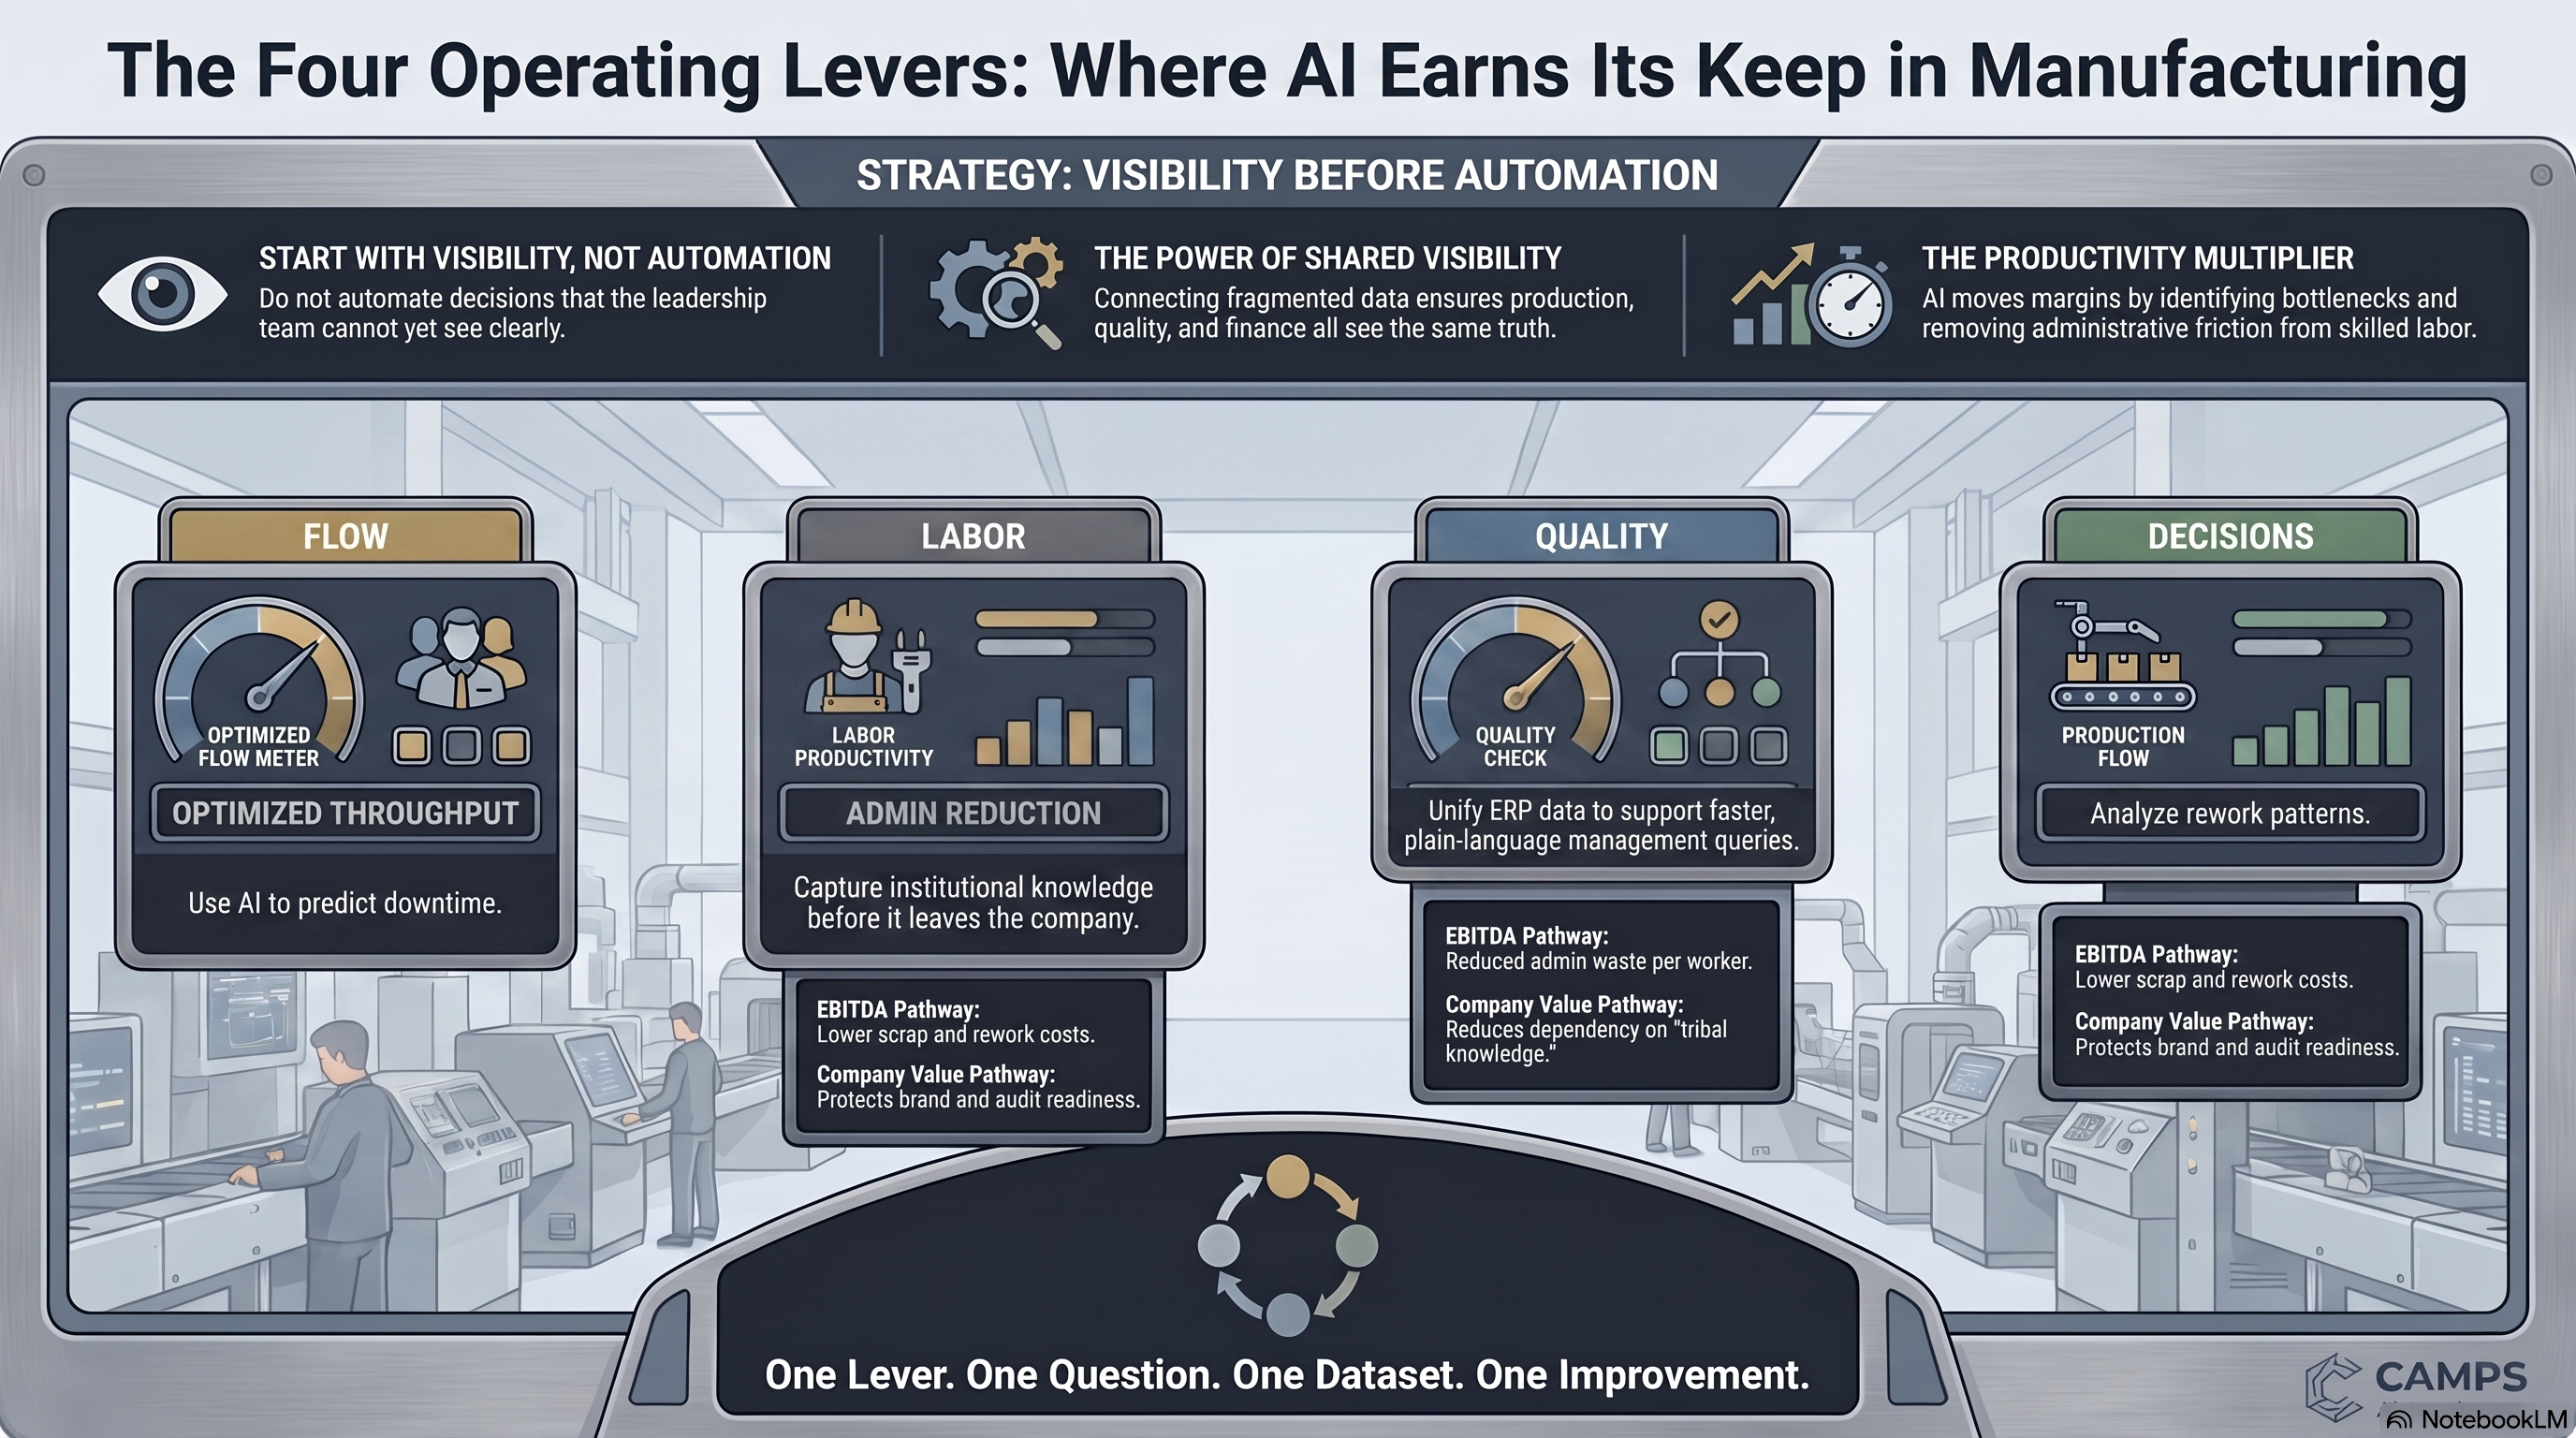
Stop Chasing the AI Hype: Why "Shared Visibility" Is the Real Secret to Manufacturing Value
- Production Flow: Seeing where capacity is gained or lost.
- Data Signals: Vibration, temperature, and sensor readings; downtime duration and reason codes.
- Leadership Question: "Where are we losing the most productive time, and which constraints are predictable?"
- Labor Productivity: Removing administrative friction to increase output per worker.
- Data Signals: Shift handoff notes, SOP gaps, and supervisor logs.
- Metric to Watch: Supervisor Span of Control. How much time is lost to reporting versus coaching?
- Quality: Identifying "process drift" before it becomes scrap.
- Data Signals: Inspection photos, rework logs, and nonconformance records.
- Leadership Question: "Where do defects actually begin, and which failures cost us the most customer trust?"
- Operational Decisions: Reducing working capital waste by connecting demand to scheduling.
- Data Signals: ERP exports, sales backlog, and inventory status.
- Leadership Question: "What is the one version of the truth for our commitments today?"
- Days 1–15: Pick one painful workflow or decision tied to a single operating lever (e.g., downtime on a specific line).
- Days 16–30: Inventory existing data. Identify where the information lives and how reliable it is.
- Days 31–45: Use an approved AI tool to summarize or group the existing information. Create your first "visibility view."
- Days 46–60: Fix one data weakness. Standardize your reason codes or require a specific field in your handoff notes.
- Days 61–75: Run the analysis again. Review the clearer insights with your leadership team.
- Days 76–90: Decide whether to continue, automate that specific workflow, or move to the next use case.
Listen to the Podcast While You Work
Instructions: For best results and insights, save this assignment image to your device, then upload it to your preferred AI platform. Ask your AI to help you answer the questions in the assignment.
.png?width=1200&height=799&name=Designer%20(7).png)



.jpg)